
Faster Than runc: Benchmarking Edera on Amazon EKS
We like to consider ourselves virtualization experts. Even we assumed virtualization had a noticeable (but negligible) performance tax compared to containers. I mean, a hypervisor adds latency, it’s just physics right? We've never been happier to be proven wrong.
Edera zones run every pod with its own Linux kernel inside a lightweight VM. That even sounds expensive. Every benchmark run on a sandbox leads to expectations of overhead that starts at "not great" and ratchets up to full-on wincing for platform engineers. gVisor costs 13% on CPU and obliterates Redis throughput. Kata adds 4% CPU overhead and 12-16% on disk I/O. These are numbers that make platform engineers say, "Maybe security isn't that big of a priority."
So when we ran benchmarks on the latest version of Edera on a real EKS cluster against real performance acceptance criteria, we kind of expected to spend our time justifying (the negligible) overhead or filing issues for future optimizations in the product. Instead, we had to double-check our methodology because the numbers looked too good to be true, even compared to earlier versions of our benchmarking.
Gather around the campfire, let’s cover how vCPUs, paravirtualized scheduling, and raw block devices make isolation nearly invisible for performance.
Our Benchmark Rig
A prospect was evaluating Edera for production EKS workloads running untrusted user code. Their acceptance criteria: every benchmark must be within 5% of runc baseline. CPU, memory bandwidth, and startup time, with zero exceptions.
We ran everything on AWS c6i.4xlarge instances (16 vCPU, 32 GiB RAM) in us-west-2. We deployed two nodes: one running the Edera runtime, and one running vanilla runc. Same instance types, same EBS gp3 storage, same EKS cluster, the only difference was the runtime.
Tools: sysbench 1.0.20 for CPU and memory. We used five runs per configuration, with means and standard deviations reported. Every test is fully reproducible using our published CPU benchmarking guide and memory benchmarking guide.
One critical annotation: dev.edera/cpu: "15". Edera zones don't automatically inherit Kubernetes CPU requests as guest vCPU count (yet). Kubernetes CPU limits are container-scoped throttling controls. Edera zones are per-pod VMs that need an explicit annotation to define their virtual hardware topology. Eventually, this will be integrated into the Kubernetes API, but for now, without that annotation, you get the default 2 vCPUs regardless of what Kubernetes thinks you requested, and your benchmarks will look like the runtime is a lot slower. Turns out it's not, you just gave your workload two cores and asked it to do the work of fifteen.
CPU Benchmark: +3.3% vs runc on Amazon EKS (Yes, Faster)

Edera was faster than runc. Not by a lot, but consistently across five runs with tighter variance than runc.
Before you assume we're cherry-picking: we need to be honest about why this number looks the way it does. Edera zones run on kernel 6.18, which uses the EEVDF scheduler. The runc baseline node was running kernel 6.12 with CFS. That's a confounding variable, some of this delta is likely scheduler-algorithm, not runtime architecture.
What is architectural: Edera is built on a Type 1 (bare-metal) hypervisor derived from Xen. Paravirtualized guests avoid the trap-and-emulate overhead that plagues nested virtualization (the model Kata uses when running inside cloud VMs). The guest kernel makes direct hypercalls instead of triggering expensive VMEXITs on privileged instructions. That said, Edera zones still have double-scheduling. Xen's credit2 scheduler manages vCPU time slices, and the guest kernel's EEVDF scheduler manages processes within those slices. In theory, that's overhead. In practice, the L2 scheduler manages fewer processes and Xen primarily schedules vCPUs, keeping the overhead negligible.
We're not claiming Edera is universally faster than containers. The +3.3% likely reflects a combination of kernel version differences and favorable scheduling dynamics for this specific workload profile. The point is: for a multi-threaded, CPU-pinned workload, the performance tax people expect from VM isolation isn't there. We're at parity or better, and we're investigating latency jitter characteristics to get the complete picture.
Correcting Our Memory Bandwidth
Our first testing run said memory bandwidth was 19.3% slower, so we brought it to our engineering team. They responded with "How many threads did you run? Umm.. sixteen, on fifteen vCPUs.
The extra thread had no physical core to land on in the Edera zone. runc, sharing the host kernel, could borrow the 16th core from the host. We were comparing 16 threads on 16 cores against 16 threads on 15 cores and calling it a runtime overhead. It wasn't; it was user error.
We re-ran with corrected thread counts:
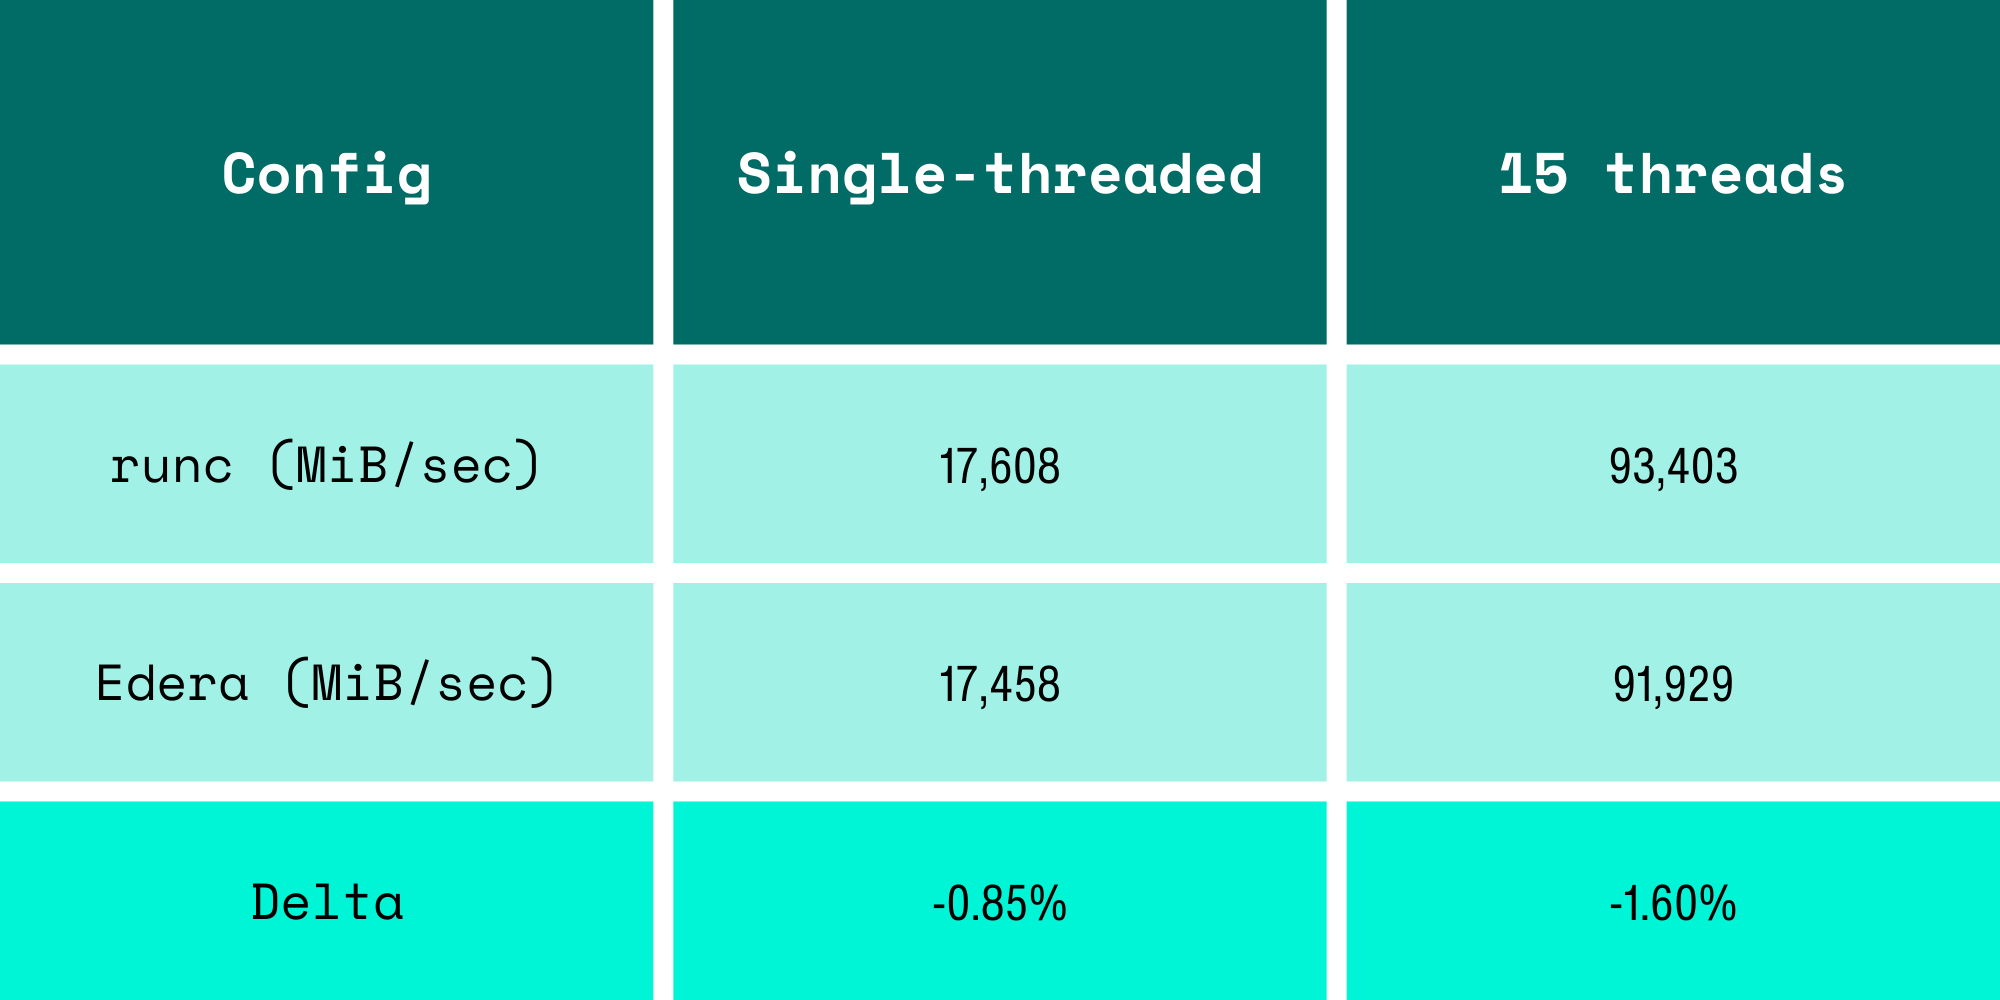
The "19% memory overhead" was due to us running the benchmark incorrectly.
This was a hard lesson learned. When your thread count doesn't match your vCPU count, you're benchmarking your test methodology, not the runtime. This mistake would have booby-trapped any VM-based isolation, not just Edera.
The I/O Storage Path: Choose Wisely
Then we turned our attention to I/O, and immediately learned something the hard way: storage configuration matters more than the runtime.
Our initial fio runs used the Kubernetes default volumeMode: Filesystem. In an Edera zone, this forces writes through overlayfs and 9pfs, a userspace filesystem protocol that serializes I/O operations and adds context switches on every write. The results were not competitive, and for a well-understood reason: you're adding a protocol translation layer between the guest kernel and the block device.
The fix is volumeMode: Block, which passes a raw block device directly into the zone VM. No 9pfs, no unnecessary copies, just the guest kernel talking to a block device like it would on bare metal. This is the correct way to benchmark I/O in any VM-based isolation runtime, and it's a gotcha that applies equally to Kata and Firecracker.
We're finalizing our block-mode I/O benchmarks on EKS and will publish the results in a follow-up post. For now, the takeaway is: if your VM isolation I/O looks terrible, check volumeMode before blaming the hypervisor.
2 Second Pod Startup, Without Optimizations
After some confusion with how Kubernetes measures timing, we measured pod startup time properly using Kubernetes API timestamps (pod creation to Ready condition), pre-pulled images, and found:
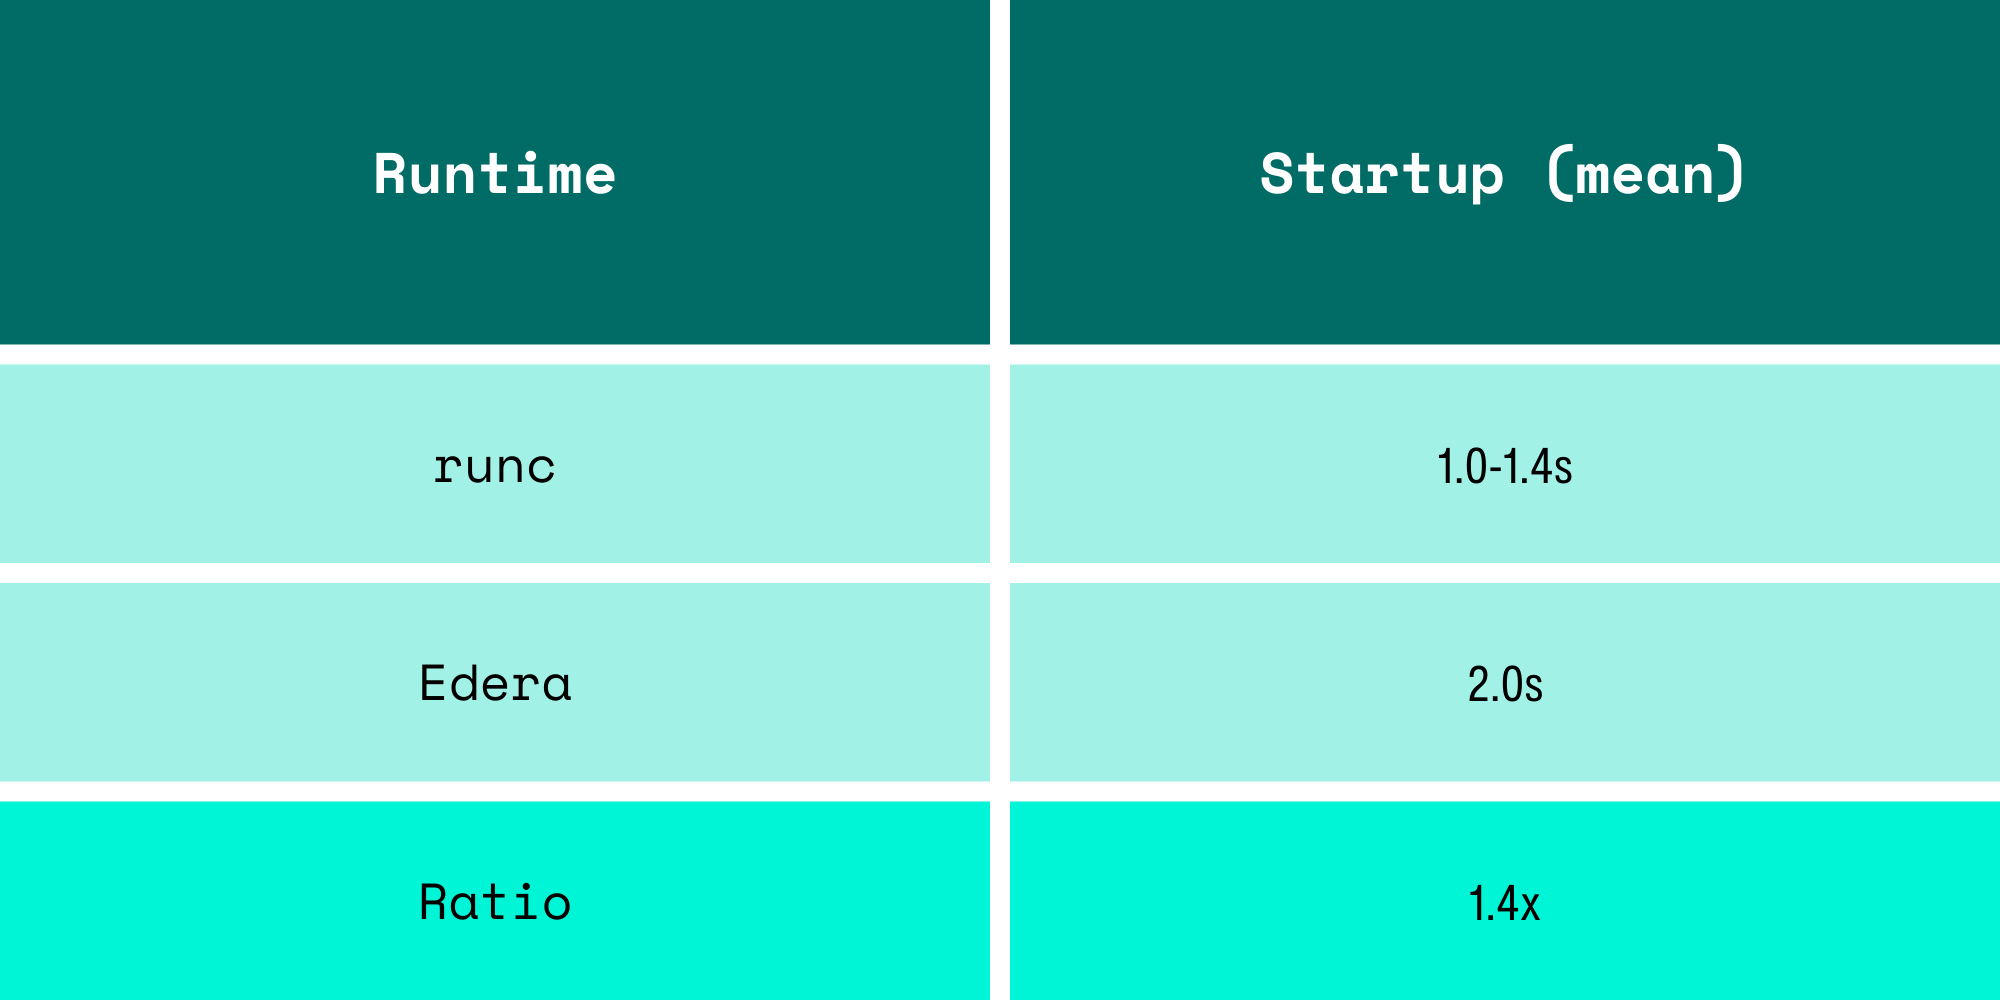
Earlier numbers from cold starts looked worse, including image pulls on first boot. With images pre-pulled (which is how any production cluster operates), the zone boots in 2 seconds. One extra second to get a fully isolated microVM with a dedicated kernel to run untrusted code. For workloads that run for minutes or hours, this is effectively invisible.
How This Compares
There are published benchmarks for other isolation runtimes that paint a consistent picture. These numbers come from third-party testing, not ours:
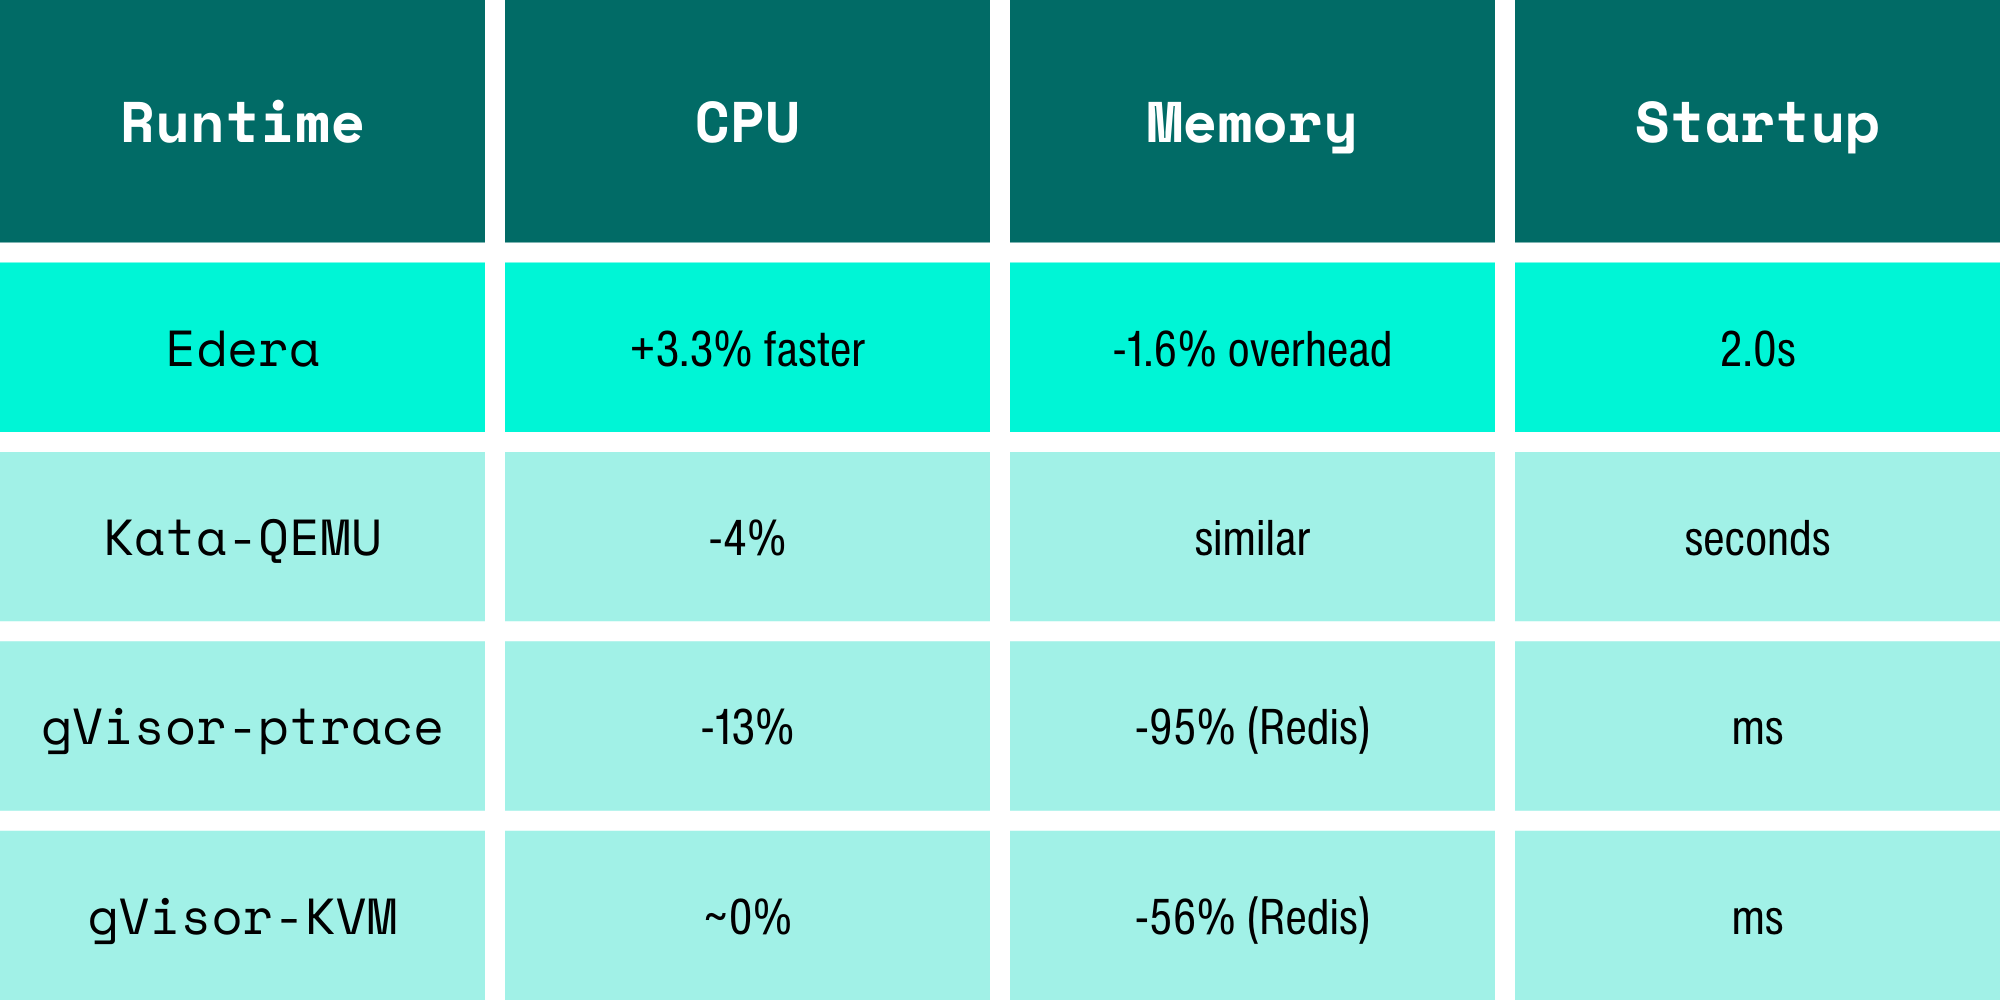
A caveat on these numbers: throughput benchmarks don't tell the whole story. Raw CPU throughput can mask latency jitter, which matters for isochronous workloads like video processing or real-time inference. A runtime could show higher throughput while occasionally dropping frames. We're building a latency jitter benchmark to measure this properly and will publish those results separately. We suspect the results will be interesting across the board.
We want to be clear: Kata and gVisor are serious projects built by talented engineers solving hard problems. gVisor's syscall interception model gives you defense-in-depth that pure VM isolation doesn't. Kata deployed the "VM per pod" model that Edera builds on. The performance differences come from architectural decisions, not engineering quality. Edera's Type 1 hypervisor avoids the overhead of nested virtualization (Kata on cloud VMs) and userspace syscall emulation (gVisor). That's a design tradeoff, not a slight against their efforts.
Benchmarking VM-Based Container Isolation: Key Lessons
We learned three major things on this performance journey, all of which apply beyond Edera:
Match your threads to your vCPUs. If your isolation runtime gives the guest N cores, run N threads. Running N+1 threads and blaming the runtime for the overhead is a methodology error that will inflate your numbers for any VM-based system.
Check your storage path. volumeMode: Filesystem forces userspace filesystem translation in VM-based runtimes. volumeMode: Block gives the guest direct block device access. The difference can be 3x or more on write IOPS.
Measure with Kubernetes timestamps, not wall clocks. Pod creation to Ready condition, pulled from the API server, gives you consistent, comparable startup measurements that don't include image pull variables.
Reproduce It Yourself
Every benchmark in this post is reproducible on your own EKS cluster. The guides are published on our docs site:
You can deploy two pods, run sysbench, and compare the numbers to your own. If your results don't match ours, we want to know. Reach out and let us know.
We assumed we'd find a performance tax that was noticeable but hopefully reasonable. What we found was 3% faster CPU and 1.6% memory overhead instead. The expensive part of VM isolation is no longer the virtual machine; it's the benchmark misconfigurations.
FAQs
Is VM-based container isolation slower than runc?
Benchmark results on Amazon EKS show that Edera runs within ~2% of runc performance, with CPU benchmarks even showing a small improvement.
Why can a microVM runtime be faster than containers in some benchmarks?
Kernel scheduler differences and CPU pinning behavior can sometimes favor VM-isolated workloads, especially with newer Linux scheduling algorithms like EEVDF.
What affects storage performance in VM-based container runtimes?
Storage configuration matters. Filesystem volumes may introduce userspace translation layers like 9pfs, while block-mode volumes allow direct device access for near-native I/O performance.
How much slower are isolated containers to start?
In this benchmark, Edera pods with cached container images started in roughly 2 seconds, compared to 1–1.4 seconds for runc, a difference that becomes negligible for long-running workloads.
-3.avif)